How to build a Open Data Insights AI Agent
The Open Data Insights Agent reduces the burden on analysts by generating data visualizations, speeding up decision cycles and equipping local governments to make data-driven, defensible choices about housing policy, public safety, and community health.
Challenge
Many government and nonprofit teams struggle with fragmented public datasets, limited analyst capacity, and the difficulty of turning raw numbers into timely, actionable insights for policy, planning, and community reporting.
Industry
Government
Department
Content Creation
Integrations

OpenAI

Web Search
TL;DR
This AI agent automates open data research and analysis. It interprets a user’s question, finds relevant public datasets, performs deep research, synthesizes insights, and delivers a polished, visual report—no data science skills required.
What It Does
Understands a user’s open data question (e.g., “Homelessness in LA”)
Finds and analyzes authoritative public datasets (Census, FBI, CDC, etc.)
Performs deep research and trend analysis using AI
Synthesizes findings into a clear, decision-ready report with suggested visualizations
Who It’s For
Policy analysts, journalists, researchers, and civic tech teams
Anyone needing fast, reliable insights from public/open data
Non-technical users who want data-driven answers without coding
Time to Value
Minutes: Just describe your question—get a full analysis and report in one go
No manual data wrangling, searching, or chart-building required
Output
A markdown report with:
Executive summary
Key trends, patterns, and comparative insights
Citations to data sources
Suggested and generated charts/visualizations
Common Pain Points for Open Data Analysis
Finding trustworthy, up-to-date datasets
Translating business questions into data queries
Combining multiple sources for comparative analysis
Creating clear, visual reports for non-technical audiences
Time-consuming manual research and charting
What This Agent Delivers
Automated discovery of relevant public datasets
AI-driven research and trend analysis
Side-by-side comparisons across time, geography, or demographics
Clear, markdown-formatted reports with visualizations
Citations and links to all data sources
No coding or data science expertise required
Step-by-Step Build (StackAI Nodes)
Below is a walkthrough of each node in the workflow, what it does, and its goal:
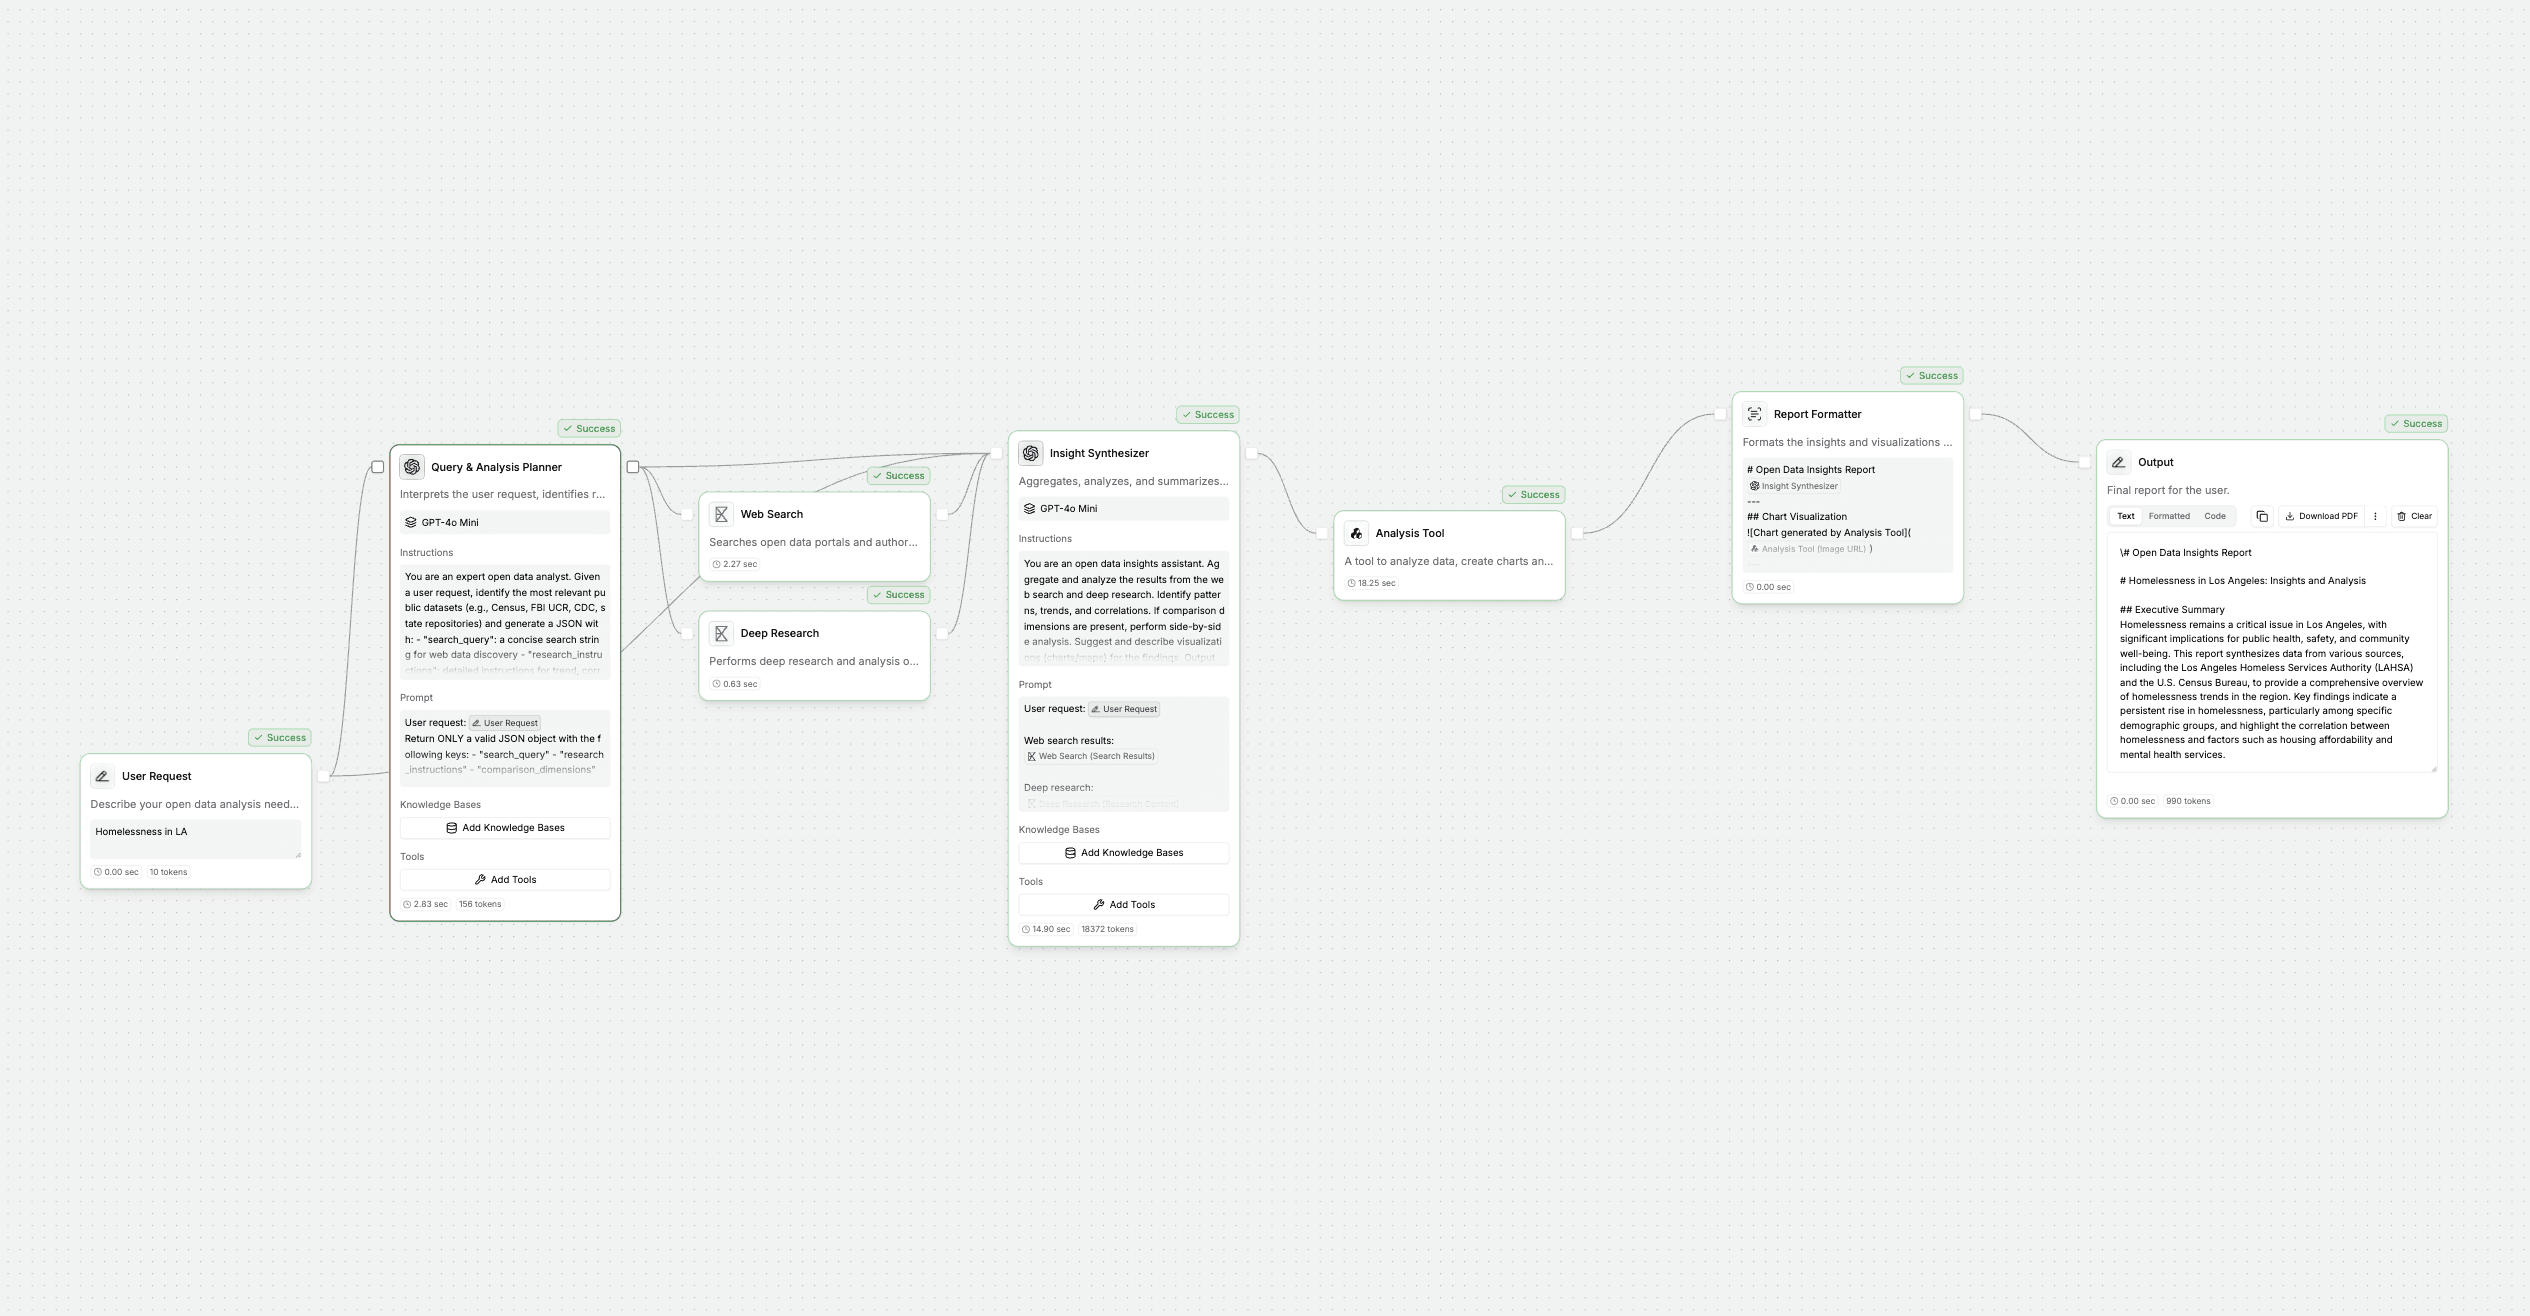
1) User Request (in-0)
What it does:
Collects the user’s open data question or analysis need.
Goal:
Capture the research topic in plain language.
2) Query and Analysis Planner (llm-0)
What it does:
Interprets the user’s request.
Identifies relevant public datasets.
Generates a structured plan for research and analysis (as JSON).
Goal:
Translate the user’s question into actionable research steps and search queries.
Instructions
Prompt
3) Web Search (action-0)
What it does:
Searches authoritative open data portals (e.g., Census, FBI, CDC) for datasets matching the plan.
Goal:
Find the most relevant, trustworthy data sources for the analysis.
4) Deep Research (action-1)
What it does:
Performs in-depth research and analysis on the discovered data sources.
Goal:
Extract deeper insights and context from the data.
5) Insight Synthesizer (llm-1)
What it does:
Aggregates and analyzes all findings.
Identifies trends, patterns, and comparative insights.
Suggests and describes visualizations.
Outputs a markdown report for decision-makers.
Goal:
Turn raw data and research into a clear, actionable report.
Instructions
Prompt
6) Analysis Tool (action-2)
What it does:
Analyzes data, creates charts, and translates natural language analysis requests into Python code.
Executes the generated Python code in a secure, stateless environment.
Returns the code, results, and a public URL to any generated chart or image.
Goal:
Automate the process of data analysis and chart creation based on the synthesized insights, making results visual and actionable.
7) Report Formatter (template-0)
What it does:
Formats the insights and generated chart into a user-friendly markdown report.
Goal:
Deliver a polished, readable report ready for sharing or presentation.
8) Output (out-0)
What it does:
Presents the final report to the user.
Goal:
Provide a single, clear output containing all findings and visualizations.


